The record
The record
Everything a reader needs to check the poster: the sheet, the protocol, every number with its source, the correction with its files, and the references with DOIs.
The A0
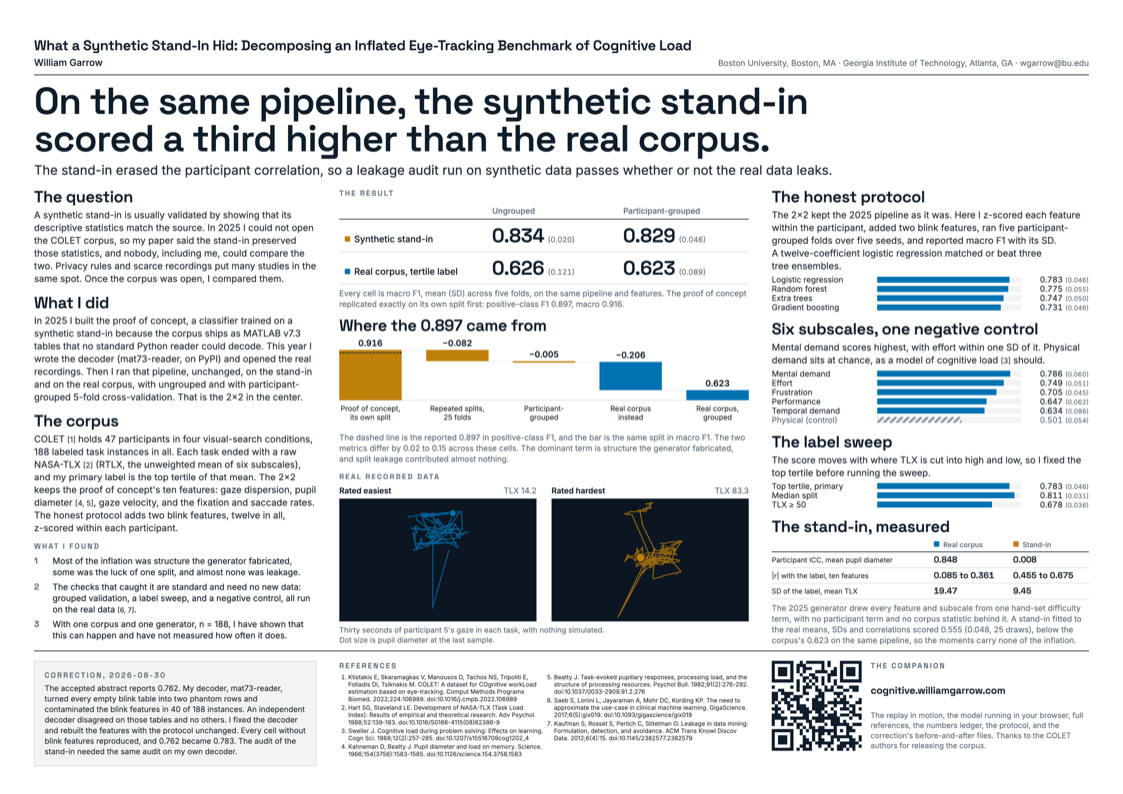
The sheet as printed: A0 landscape, 46.8 × 33.1 inches, vector throughout, 488 KB. File NEW-2026-A0-Garrow-2026-11-07-r8.pdf, SHA-256 beginning bee4ec70. Generated from HTML by the project's own renderer; every figure on it is drawn from the frozen results, and the two gaze panes are the recorded data.
Open the PDF ↗The protocol
- Corpus and label
- COLET, 47 participants, 188 task instances. Primary label: the top tertile of mean RTLX (at or above the two-thirds quantile), positive rate 36%.
- Features, the 2×2
- The proof of concept's ten: mean, SD and max gaze velocity; fixation rate; saccade rate; horizontal and vertical gaze dispersion; mean pupil diameter, its SD and its range.
- Features, the honest protocol
- The ten plus blink rate per minute and mean blink duration, twelve in all, z-scored within each participant.
- The 2025 pipeline
- StandardScaler and a random forest of 100 trees at depth 5, random state 42, as published. Run unchanged on the stand-in and on the corpus, with ungrouped 5-fold and with participant-grouped 5-fold cross-validation, one pass; cells report the mean (SD) across the five folds.
- The honest protocol
- StratifiedGroupKFold, five folds, five seeds (11, 22, 33, 44, 55), participant-grouped; macro F1 with its SD across the 25 folds. Models: logistic regression (the winner), random forest, extra trees, histogram gradient boosting.
- Secondary targets
- The six RTLX subscales as tertile labels, and three cuts of the mean (tertile, median, 50), all scored by the frozen winner under the same protocol (E7).
- The stand-in checks
- E8: the archived 2025 stand-in against the corpus, marginals, ICC(1) with participant as the grouping factor, and feature-label correlation. E9: stand-ins fitted to the corpus's first two moments, 25 draws each, through the 2025 pipeline.
- The live model
- The winner's configuration fitted on all 188 rows for the demonstration (demo_model.json); its reported score is the cross-validated 0.783.
Numbers ledger
Every number on the poster and in this companion, with the experiment and the frozen file it comes from. The files live in the cognitive-load repository's results folder.
| Value | What it is | Source |
|---|---|---|
| 0.834 (0.020) | Synthetic stand-in, ungrouped: macro F1, mean (SD) across five folds, the 2025 pipeline | E5, e5_metrics.json |
| 0.829 (0.046) | Synthetic stand-in, participant-grouped | E5, e5_metrics.json |
| 0.626 (0.121) | Real corpus, tertile label, ungrouped | E5, e5_metrics.json |
| 0.623 (0.089) | Real corpus, participant-grouped: the headline's real number | E5, e5_metrics.json |
| 0.897 | Proof of concept on its own split, positive-class F1, as reported in 2025 | E5 replication |
| 0.916 | The same split in macro F1: the waterfall's first bar | E5, e5_metrics.json |
| −0.082 | Replacing the one split with five-fold cross-validation (one seed); the printed sheet says 25 folds, see the erratum | E5 |
| −0.005 | Grouping the folds by participant, on the synthetic data | E5 |
| −0.206 | Replacing the stand-in with the real corpus | E5 |
| 0.02 to 0.15 | Gap between positive-class and macro F1 across the 2×2 cells | E5, e5_metrics.json |
| 0.783 (0.046) | Honest protocol, logistic regression; also the top-tertile row of the sweep | E4 / E7, results_v1.json, e7_targets.json |
| 0.775 (0.055) | Random forest, honest protocol | E4, results_v1.json |
| 0.747 (0.050) | Extra trees | E4, results_v1.json |
| 0.731 (0.046) | Gradient boosting | E4, results_v1.json |
| 0.786 (0.060) | Mental demand as the label | E7, e7_targets.json |
| 0.749 (0.051) | Effort | E7 |
| 0.705 (0.045) | Frustration | E7 |
| 0.647 (0.062) | Performance | E7 |
| 0.634 (0.086) | Temporal demand | E7 |
| 0.501 (0.054) | Physical demand, the negative control: chance | E7 |
| 0.811 (0.031) | Median split | E7 |
| 0.678 (0.036) | TLX ≥ 50 | E7 |
| 0.848 vs 0.008 | ICC of mean pupil diameter, real corpus vs the archived stand-in | E8, e8_standin_check.json |
| 0.085 to 0.361 vs 0.455 to 0.675 | |r| between each of the ten features and the label, real vs stand-in | E8 |
| 19.47 vs 9.45 | SD of the label (mean TLX), real vs stand-in | E8 |
| 0.555 (0.048, 25 draws) | A stand-in fitted to the real means, SDs and correlations, same pipeline, grouped | E9, e9_fitted_standin.json |
| 0.762 to 0.783 | The accepted abstract's headline and the corrected one | E6, results_v1.json |
| 40 of 188 | Instances whose blink features the decoder bug contaminated | E6, features_v2 files |
| 47, 188, 36% | Participants, labeled instances, positive rate of the tertile label | features_v2.csv, e7_targets.json |
Correction, 2026-08-30
The accepted abstract reports 0.762. My decoder, mat73-reader, turned every empty blink table into two phantom rows and contaminated the blink features in 40 of 188 instances. An independent decoder disagreed on those tables and no others. I fixed the decoder and rebuilt the features with the protocol unchanged. Every cell without blink features reproduced, and 0.762 became 0.783. The audit of the stand-in needed the same audit on my own decoder.
The abstract went out on August 12, 2026 and was accepted on August 28, carrying the July 14 freeze; the poster and everything after it carry the corrected values.
The mechanism: mat73-reader 0.1.0 and earlier read a zero-row MATLAB table as two rows of [0, 1]. Forty of the 188 COLET instances have empty blink tables, so blink rate and mean blink duration were fabricated for those rows (two blinks per span, 0.5 s each). Fixed in mat73-reader 0.1.1; the feature table was rebuilt and E2, E3 and E4 rerun under the unchanged protocol. Every cell without blink features reproduced the original values exactly.
| Macro F1 | Abstract (July 14) | Corrected (Aug 30) |
|---|---|---|
| Logistic regression, the winner | 0.762 (0.050) | 0.783 (0.046) |
| Random forest | 0.727 | 0.775 (0.055) |
| Extra trees | 0.717 | 0.747 (0.050) |
| Gradient boosting | 0.668 | 0.731 (0.046) |
| Mental demand | 0.781 | 0.786 (0.060) |
| Physical demand, the control | 0.513 | 0.501 (0.054) |
| Label sweep, range | 0.637 to 0.825 | 0.678 to 0.811 |
The files, kept side by side: features_v2_2026-07-14_contaminated.csv and features_v2.csv; results_v1_2026-07-14_contaminated.json and results_v1.json; demo_model_2026-07-14_contaminated.json and demo_model.json. The 40 instances, by participant and condition:
1: 2 · 2: 1, 2 · 5: 1 · 8: 1, 2 · 10: 2 · 12: 1, 2 · 13: 2 · 17: 2 · 18: 2 · 19: 1, 2 · 22: 1, 2 · 23: 2 · 25: 2 · 26: 1 · 27: 1, 2 · 28: 2 · 29: 2 · 31: 2 · 32: 2 · 33: 1 · 34: 1, 2, 3 · 35: 2 · 36: 1, 2 · 37: 2 · 38: 2 · 39: 1 · 41: 1, 2, 3 · 45: 2 · 47: 2
Read as participant 1, condition 2 for the first entry. Thirty-one participants, mostly conditions 1 and 2, the two without the counting task.
Erratum on the printed sheet, 2026-11-08
The waterfall's second step is labelled “Repeated splits, 25 folds” on the A0. The 2×2 cells it leads to are one seed of five folds, as the sheet's own 2×2 caption says (E5: StratifiedKFold and GroupKFold, five splits, random state 42). The step and its value are unchanged; the label here and on the deck reads “five folds.” Twenty-five folds, five seeds by five, is the honest protocol's count.
The feature story, held off the deck
The 2025 proof of concept told a saccade-dominance story. These two columns are two different experiments: the stand-in column is the random forest's importances on the stand-in's own ungrouped split (positive-class F1 0.897); the corpus column is the same ten features and model on the real corpus under a single pass of participant-grouped folds (E0, macro F1 0.665 with SD 0.084). Two protocols and two metrics, so they do not sit in one chart on the poster. The like-for-like comparison is the 2×2, where the real corpus scores 0.623.
| Feature importance | Stand-in, 2025 split | Real corpus, E0 |
|---|---|---|
| Saccade rate | 0.394 | 0.108 |
| Gaze dispersion (horizontal) | 0.210 | 0.067 |
| Pupil diameter range | 0.159 | 0.156 |
| Mean pupil diameter | 0.090 | 0.067 |
| Max gaze velocity | 0.076 | 0.129 |
| Fixation rate | 0.029 | 0.076 |
| Mean gaze velocity | 0.018 | 0.096 |
| Pupil diameter (SD) | 0.012 | 0.095 |
| Gaze velocity (SD) | 0.011 | 0.133 |
| Gaze dispersion (vertical) | 0.001 | 0.072 |
The stand-in checks
E8 measured the archived 2025 stand-in against the corpus. On every feature the marginal means miss, by 0.05× to 25.7×, and every SD is far too small; the participant structure is absent; and the features are two to six times as coupled to the label as the real ones.
| Measure | Real corpus | Stand-in |
|---|---|---|
| Participant ICC, mean pupil diameter | 0.848 | 0.008 |
| |r| with the label, ten features | 0.085 to 0.361 | 0.455 to 0.675 |
| SD of the label, mean TLX | 19.47 | 9.45 |
E9 fitted two stand-ins to the corpus's own statistics and ran the 2025 pipeline on them, 25 draws each, mean (SD across draws), ungrouped and grouped: independent normals with the real means and SDs, 0.443 (0.037) and 0.435 (0.035); one multivariate normal with the real means, SDs and correlations, 0.557 (0.042) and 0.555 (0.048). The real corpus on the same pipeline: 0.626 and 0.623. The archived stand-in: 0.834 and 0.829. A stand-in that passes the descriptive check scores below the corpus, never above it; the moments carry none of the inflation.
References
- Ktistakis E, Skaramagkas V, Manousos D, Tachos NS, Tripoliti E, Fotiadis DI, Tsiknakis M. COLET: A dataset for COgnitive workLoad estimation based on eye-tracking. Comput Methods Programs Biomed. 2022;224:106989. doi:10.1016/j.cmpb.2022.106989
- Hart SG, Staveland LE. Development of NASA-TLX (Task Load Index): Results of empirical and theoretical research. Adv Psychol. 1988;52:139-183. doi:10.1016/S0166-4115(08)62386-9
- Sweller J. Cognitive load during problem solving: Effects on learning. Cogn Sci. 1988;12(2):257-285. doi:10.1207/s15516709cog1202_4
- Kahneman D, Beatty J. Pupil diameter and load on memory. Science. 1966;154(3756):1583-1585. doi:10.1126/science.154.3756.1583
- Beatty J. Task-evoked pupillary responses, processing load, and the structure of processing resources. Psychol Bull. 1982;91(2):276-292. doi:10.1037/0033-2909.91.2.276
- Saeb S, Lonini L, Jayaraman A, Mohr DC, Kording KP. The need to approximate the use-case in clinical machine learning. GigaScience. 2017;6(5):gix019. doi:10.1093/gigascience/gix019
- Kaufman S, Rosset S, Perlich C, Stitelman O. Leakage in data mining: Formulation, detection, and avoidance. ACM Trans Knowl Discov Data. 2012;6(4):15. doi:10.1145/2382577.2382579
Reproduce
The decoder is public: mat73-reader on PyPI (pip install mat73-reader) and on GitHub. The corpus is the COLET release on Zenodo. The experiment scripts (feature extraction, E1 to E9), the feature tables and the frozen results files named in the ledger are available on request by email.
Scope
- One corpus, one generator, n = 188. The claim is existence: this can happen. How often it happens is not measured here.
- COLET's time pressure was an instruction with no visible timer, and its difficulty came mostly from the counting task; the ratings cover blocks of five screens, one per condition per person.
- The decomposition is of one proof of concept's number. The honest protocol's 0.783 is a different pipeline and is not part of the 2×2.
- Nothing on the poster or here is simulated or reconstructed; the one illustration is the drawn iris on the title slide, whose motion comes from participant 5's recorded gaze.
Cite
Garrow W. What a Synthetic Stand-In Hid: Decomposing an Inflated Eye-Tracking
Benchmark of Cognitive Load. Poster presented at: N.E.W. 2026; November 12, 2026;
Boston University, Boston, MA. https://cognitive.williamgarrow.com
Where next
Record last updated November 8, 2026. The correction note above carries its own date.